

Know What Changed, and What It Did
Agent 1.2.0 and web app 1.2.0 ship together. Most of the questions we hear from robotics teams after a rollout sound the same: which robots got the new firmware, when, and did things get better or worse? Until now the answer lived in spreadsheets, deploy logs and someone's memory.
This release puts that answer in Insaion. Robots describe themselves, every change is kept with its date, and you can put two groups of robots side by side and see what moved.
Device Tags With History
Every device now carries key:value tags. Some you set yourself, like customer:acme, software_version:1.4.2 or lidar-firmware:5.4.0. Others come from the agent on its own.
The agent reports what it finds on the robot: OS and version, kernel, CPU model, cores and architecture, memory, GPU and driver, ROS distro, RMW and domain ID, Docker version, and how the agent itself was installed. Nothing to configure. These detected tags are locked, so they always match the machine.
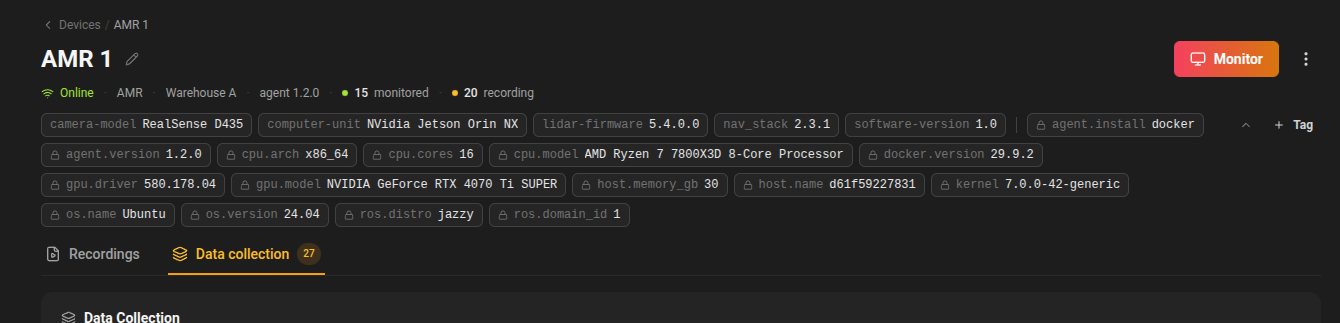
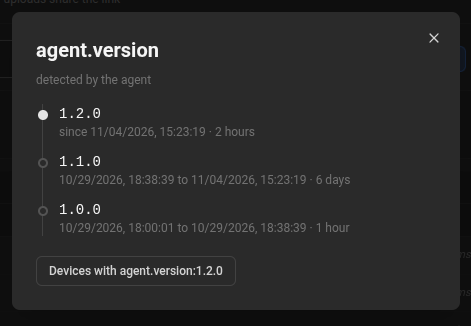
Every tag keeps its history. Click one to see each value it has had, when it started and when it ended. If a software update went out last Tuesday and nobody tagged it, add the tag with the date it really happened and Insaion treats the robot as having had that version since then.
One Way to Filter, Everywhere
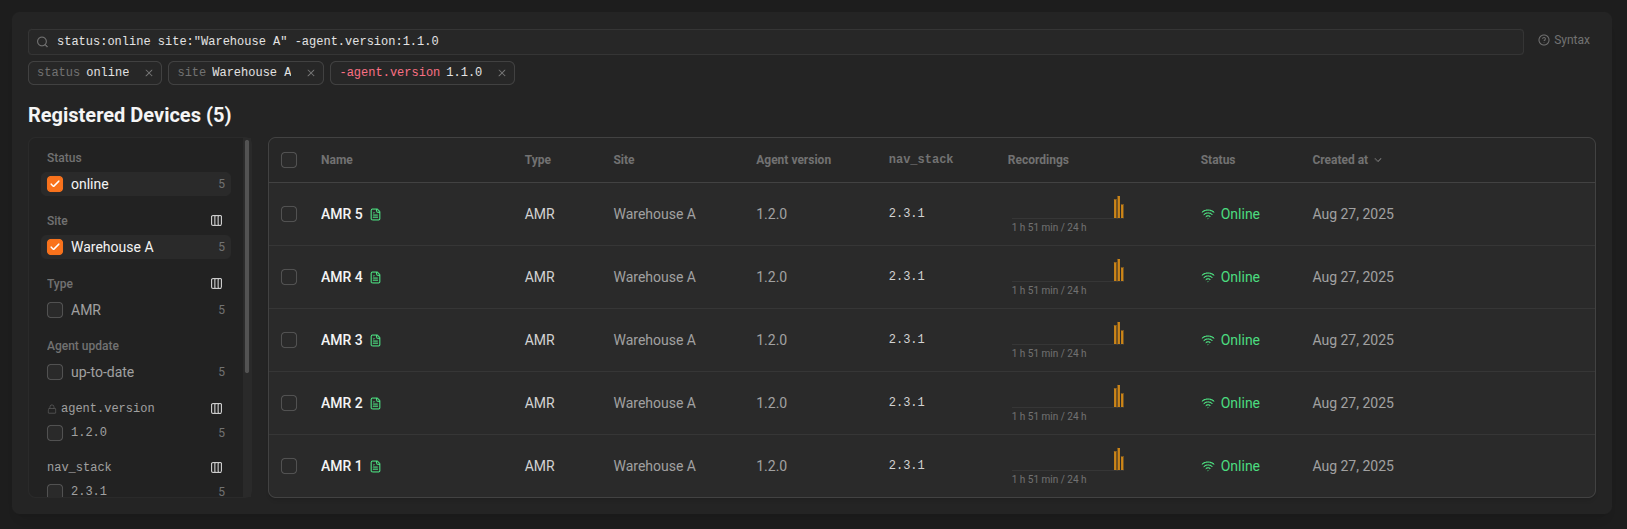
Tags come with one filter language that works on the Devices page, dashboards, alarms, recordings and the new Compare panel. Write it once, use it anywhere:
site:"Warehouse A" ros.distro:jazzyto narrow the fleet-agent.version:1.1.0to find robots that still need an updatesoftware_version:(1.4.1 OR 1.4.2)for either valuehas:customeror-has:customerfor robots with or without a tag
On the Devices page the sidebar counts robots per value, any tag can become a table column, and you can set or remove a tag on many robots at once.
Dashboards understand tags too. Add a picker per tag key and every panel follows it, group a chart by a tag, and turn on markers that show exactly when a tag changed on the robots in view. A spike that lines up with a firmware change stops being a guess.
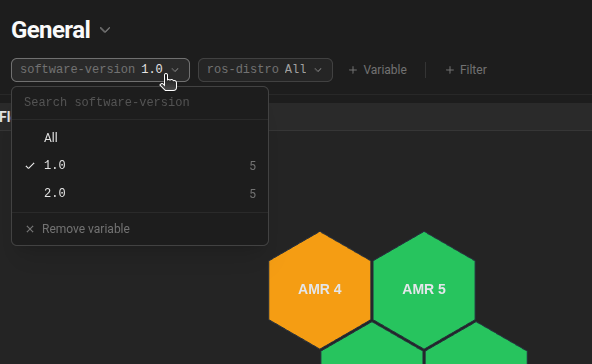
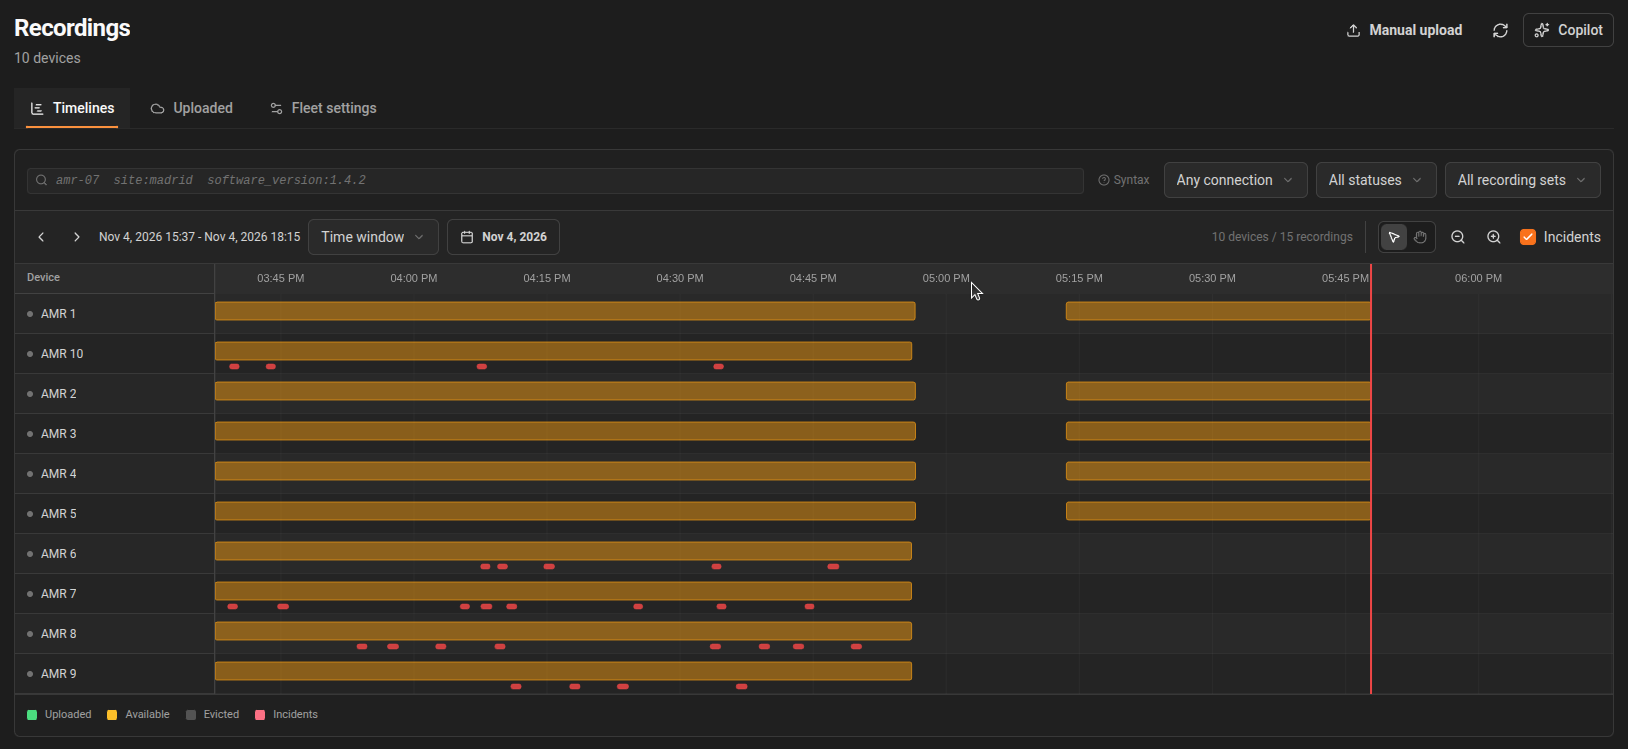
Recordings use the same search bar. A recording matches the tags its robot had when the recording started, so software_version:1.4.2 finds what was recorded while that version was running, even if the robot has been updated since.
The Compare Panel
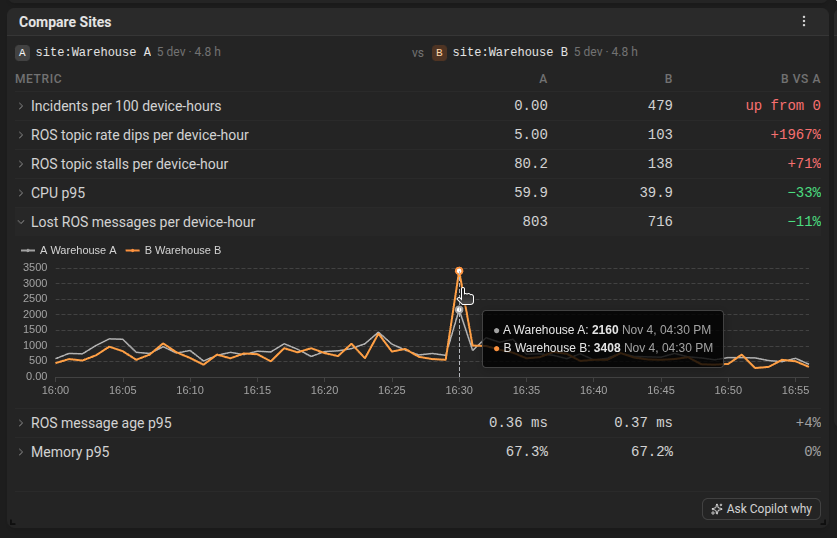
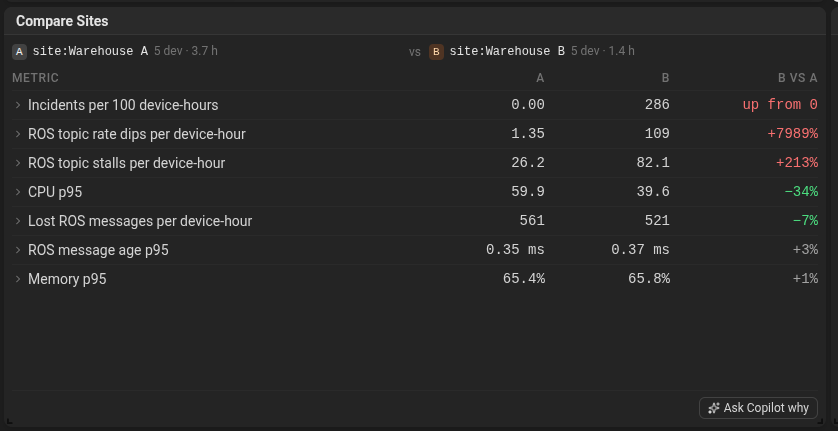
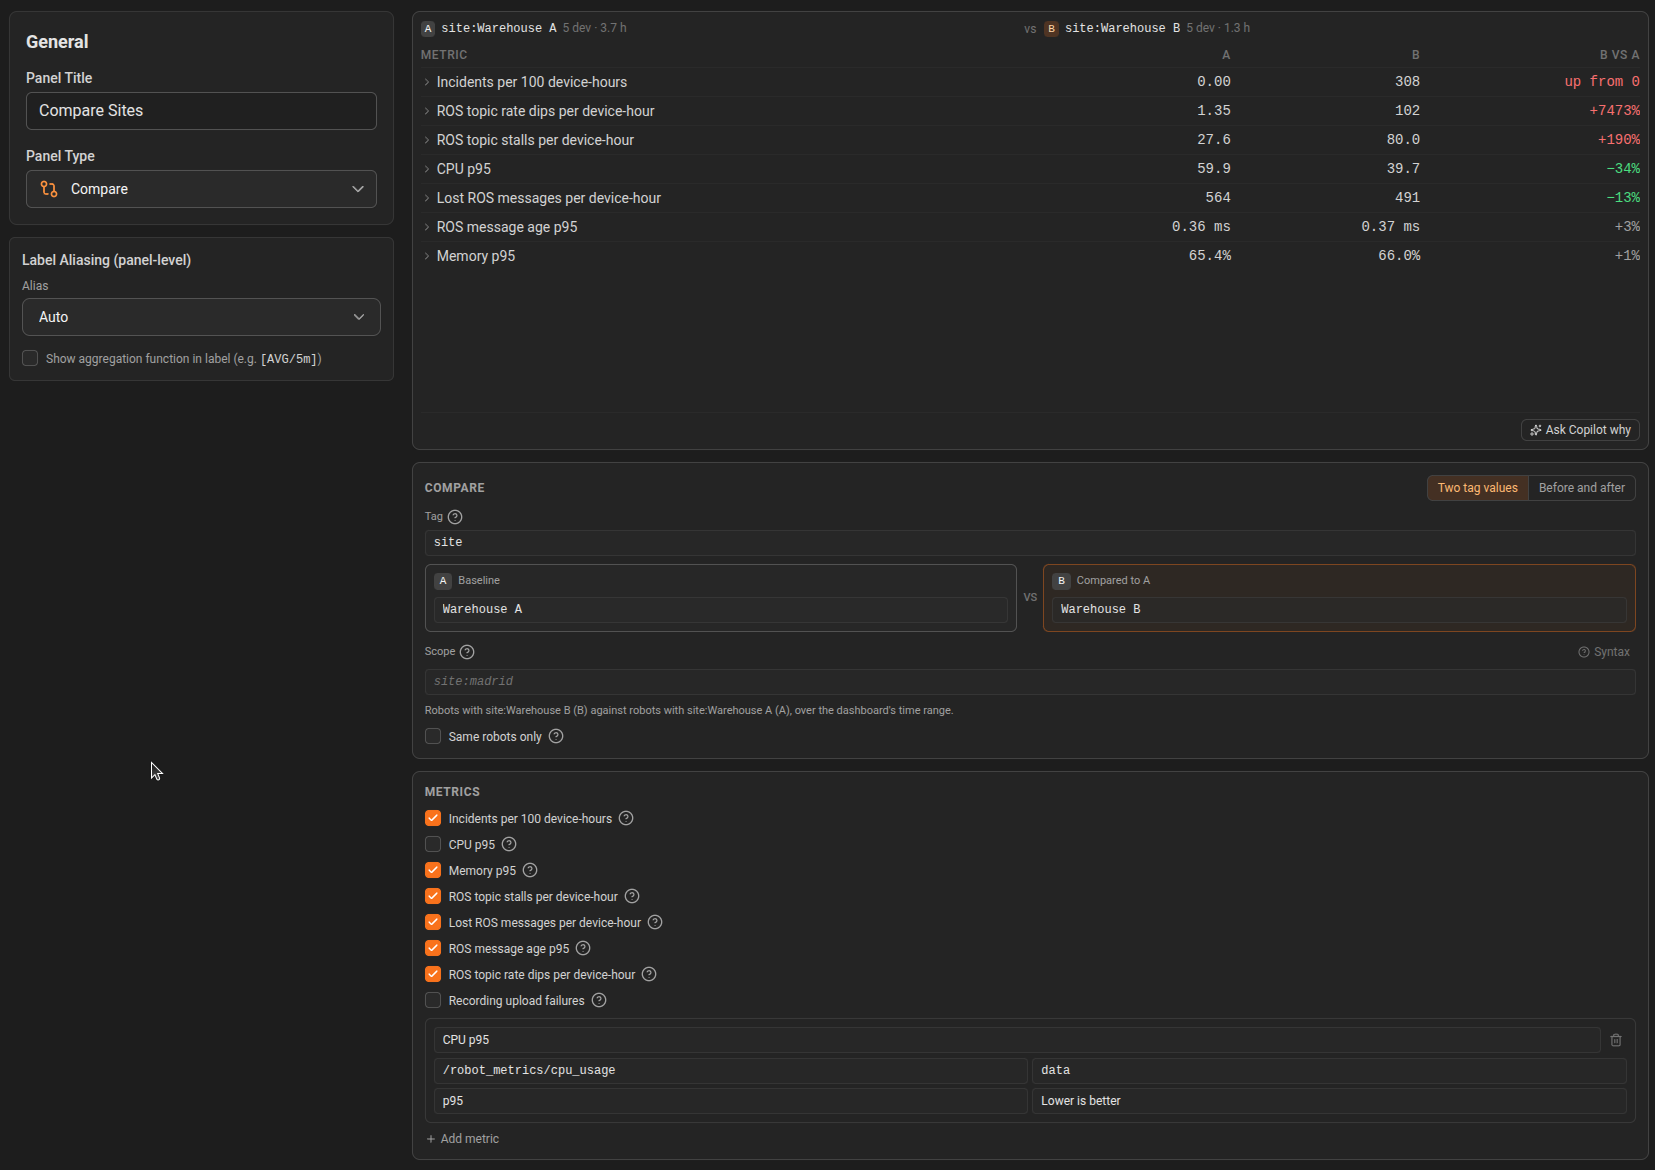
This is the part we are most excited about. The Compare panel is a new dashboard panel that puts two groups of robots side by side:
- Two tag values: firmware 1.4.1 against 1.4.2, Warehouse A against Warehouse B, one customer against another.
- Before and after: this week against last week, or two custom periods, for one group or the whole fleet.
It opens with the metrics that matter after a change: incidents per 100 device-hours, CPU and memory p95, ROS topic stalls and lost ROS messages per device-hour. You can add message age, rate dips, recording upload failures, or any numeric field your robots send, from the agent, OpenTelemetry or ROS 2 topics.
A few details make the numbers trustworthy:
- Sample size first. Each side shows how many robots and device-hours it is built on, so you know when a difference is real.
- Tags as they were. A robot updated halfway through the week counts for the old version before the update and for the new one after.
- Same robots only. One switch keeps only the robots that reported on both sides, so a new robot joining the fleet does not skew the result.
- Ranked by change. Metrics are sorted by how much they moved and colored by better or worse.
Expand any row to see both groups over time on one chart.
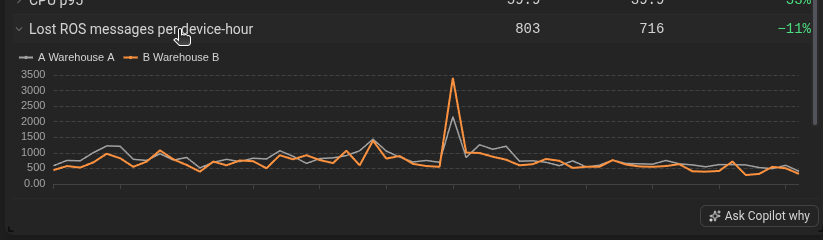
When something looks off, Ask Copilot why sends the whole table to Copilot as context for the question. If a chart is already grouped by a tag, Compare by builds the panel for you.
The Compare panel is available on the Starter plan and up.
Topic Statistics
The agent now measures every ROS 2 topic it subscribes to as messages arrive, without reading their content and before any downsampling. For each topic you get:
- the rate, and the expected rate it should hold
- the longest gap between messages and the jitter
- message age on arrival, from the publisher's timestamp
- lost messages, from DDS sequence numbers (Jazzy and later)
- publishers and throughput
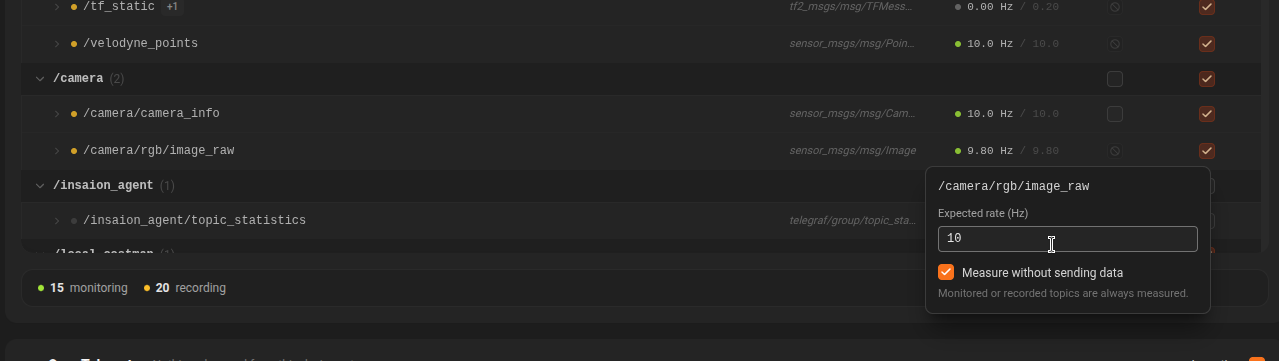
On the device page, the Rate column shows the measured rate next to the expected one. The expected rate comes from you, from the publisher's QoS deadline, or from the topic's usual rate over the last 24 hours. Topics more than 20% off turn amber. Hover a rate for the full picture.
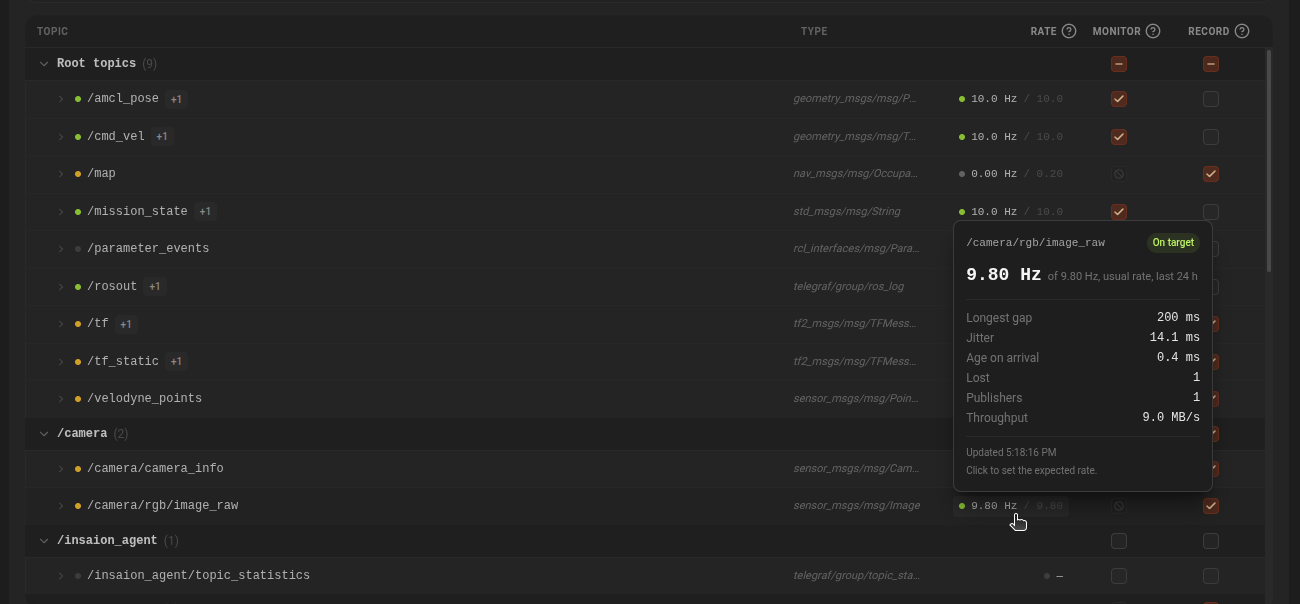
You can also measure a topic without sending its data. Heavy streams like cameras and point clouds can be checked for rate and gaps while the data stays on the robot, which costs almost nothing on the uplink.
These statistics feed the Compare panel's topic stalls and lost messages. A stall is judged against each topic's own rhythm, so a 1 Hz map and a 30 Hz camera are both held to what is normal for them.
Alarms Per Robot
Alarms now pick their robots with the same tag filters, with a live count of how many devices match right now.
New alarms alert per robot. Each robot gets its own state and its own incident, so when one robot is already firing, a second robot with the same problem still raises its own incident instead of hiding behind the first.
Incidents keep the tags their robots had when they opened, and the tag changes from the 24 hours before. Expand an incident row and the likely suspect is often right there: a new software version, a different site, a kernel update.
Notification messages can now use templates with placeholders such as {{device.name}}, {{tags.site}} or {{tags.changes_24h}}, with a preview in the editor. Alarm pages also update live as states change.
Copilot Knows What Changed
Copilot's incident analysis now receives the robot's tags and recent tag changes, in triage, in the analysis and in follow-up chats. When the same change happened on several robots, Copilot sees it as one change, which makes it much better at pointing to a rollout as the cause.
Also in This Release
- Lighter recording. The agent writes to its on-robot recording buffer over reused connections with fewer copies, using less CPU while recording.
- Cleaner Devices page. Better colors and layout, and the deleted-devices notice now only shows robots that called in during the last day, with a dismiss button.
Getting Started
Update the agent from apt or pull the new Docker image. Detected tags appear on each device as soon as it reconnects, and topic statistics start flowing right away. Tags you already had as device metadata have been moved over, with their history.
A good first step: tag your robots with the software version they run, add a Compare panel to your main dashboard, and set it to before and after. The next time you roll out an update, you will see what it did within hours.
Full details are in the docs: Tags, Compare panel and device configuration.